Solar Resource Map of Pakistan

The map below shows the solar energy falling on a horizontal surface of area 1 m2 during one year. It can be seen that areas of Balochistan and Southern Sindh are most gifted while Peshawar, Lahore and Islamabad also have quite favorable conditions. Lets assume that we are installing a Solar System in Karachi where the annual irradiation is around 2000 kWhr/m2. This means that there is an average daily irradiation of around 5.5 kWhr/m2. This means that a Solar Panel of area 1 m2 would receive 5.5 kWhr per day or 1 kW for 5.5 hours daily. If the above Solar Panel has an efficiency of 20% we can produce 200 Watts of electrical energy from it for 5.5 hours each day.

Solar Resource Map of Pakistan

Solar Resource Map of Pakistan

Note:
1. The above map is for energy collected by a horizontal surface. A suitably tilted surface or a tracking one can obtain significantly more energy.

2. The received energy not only depends upon the relative position of the Sun and Earth but also on the atmospheric conditions such as cloud cover during different seasons.

Can I Run My Air Conditioner on Solar

Air Conditioner on Solar

Air Conditioner on Solar

I have been asked this question many time by my friends "Can I Run My Air Conditioner on Solar". The short answer to this question is YES YOU CAN. Thompson N' Thompson HVAC, Inc provides heating and cooling Charlottesville, Virginia.

Lets assume that you have a basic air conditioning unit that is categorized as 1-ton. Now the way Air Conditioners work is that they draw a lot of current at the start, as much as three times the normal steady state current. So a 1-ton AC might be drawing only 1200 Watts at steady state, it may require as much as 3600 Watts at start up. Now there are two ways to solving this problem. Either you can put up 3600 Watts of Solar Panels on your roof and operate your system only when peak sunshine is available. Or, the better option is to have enough panels to run the AC at steady state and use some batteries to provide the initial peak current or power. These batteries will also provide back up after solar hours and when the electricity from the main grid is not available. Thermal Imaging for HVAC Efficiency can also help pinpoint airflow variations and duct leaks. By detecting these issues early, technicians can recommend remedies, preventing energy loss and potential damages like ac short cycling to your unit. Consider hiring a professional to complete the necessary repairs, such as North Florida heat pump repair services. You may also consider hiring a team of experts like rochester air conditioning maintenance services.

One company providing solar solutions in Pakistan recommends installing 1800 Watts of solar panels and 600 Ampere Hours of batteries. So assuming that we have 6 hours of peak sunshine available the solar panels would be able to run the AC for about 6 hours directly on solar energy (assuming an average power consumption of 1800 Watts). After the solar hours the battery would be charged by the main grid and can provide backup of around 4 hours (12 V x 600 Ah / 1800 W =4 hours). Also one must not forget that to convert DC voltages to AC voltages you would need an inverter and for controlling the charge and discharge cycles of the batteries a charge controller would be needed. Usually the modern solar inverters have built in charge controllers which somewhat limits the costs for air conditioner and heaters. HVAC repair and maintenance at the right time can save you money in the long run. Additionally, for more insights on financial incentives related to solar, check out this site at https://www.theinspirationedit.com/solar-rebates-a-financial-incentive-that-works-for-you/.

Upgrade your home with our residential solar installations in Texas, offering an efficient and cost-effective way to reduce your energy bills.

After going through all this technical jargon the question that needs to be answered is "How Much Would This System Cost". The answer to this is around Rs.450,000 including transportation and installation. You might think that this is too high a cost, but think of it this way, even if you are saving Rs.5000 on your electricity bill per month you would have saved enough to offset the cost in about 8 years. And a solar panel installation would last you much longer than 8 years (typically around 25 years).

Affordable Remediation and Emergency Services
Phone: (732) 540-7900
Url: https://affordableremediation.com/mold-testing-removal-remediation-in-toms-river/
1415 Hooper Ave
Toms River, NJ 08753

Quaid-e-Azam Solar Park - The Reality

There have been conflicting claims about the capacity of Quaid-e-Azam Solar Park (QASP) in the media. While the the chief executive officer of the Quaid-i-Azam Solar Power (Pvt) Limited claims that the project is producing 12% more energy than expected, opposition parties are claiming that it is producing only 18 MW as compared to the advertised capacity of 100 MW. So what is the truth?

Energy vs Power

Actually both the parties are correct in some sense. While the project does have the capacity to produce 100 MW peak power, this only happens for a very short duration during the day (around noon time). When averaged over 24 hours the park is only producing about 20 MW. This can be easily calculated by assuming that the peak solar energy is available for 5 hours (typical for this region) and averaging it over 24 hours.

100 MW x (5/24) = 20.83 MW

We can also calculate the average power produced by the park by looking at the numbers provided by Quaid-i-Azam Solar Power (Pvt) Limited on its website. According to the website the park is producing 169 Gigawatt Hour as compared to the original estimates of 153 Gigawatt Hour per year (a 12% increase). But this is energy, how do we calculate power?

The answer is simple, divide the energy produced in a year by the number of hours in a year (365 x 24 = 8760 hours).

Average power produced = 169 GWH / 8760 hours = 19.29 MW

Cost of Production and Tariff

The good news is that there is very minimal cost of production of solar energy (there was an installation cost of Rs.13 billion plus there are about 700 security personnel deployed for the security of 700 Chinese engineers working in the park). The tariff can be easily calculated by the revenue earned and the energy produced. According to QASP sources, the revenue reached a peak of Rs. 320 million in September. Let's calculate the cost per unit from the total revenue earned in September and the energy produced in the month of September.

Cost per unit = Rs.320,000,000/(19,290kW * 24 hours * 30 days)= Rs. 23.04/unit.

So the QASP claim that it is costing a consumer Rs.12/unit is not true. The actual cost to a consumer is Rs.23.04/unit. Again the data has been taken from the QASP website.

Environmental Impact

There is no doubt that there is going to be a negative impact on the environment. About 500 acres of desert have been taken over by QASP and this will definitely impact the biodiversity of the region. The total area dedicated to this project by Chief Minister of Punjab Mr. Shahbaz Sharif is 6500 acres (near Lal Sohanra National Park). Lastly there are vasts swaths of land in Balochistan which receive about 10-20% more Solar Irradiance than any location in Punjab and there are a number of new and existing Hydel projects that are crying for attention (case in point being Tarbela expansion which can yield additional 1400 MW of power).

Information taken from:

http://www.qasolar.com/

http://www.dawn.com/news/1217587/solar-park-producing-12pc-more-power-than-target

Solar Payback Time in Pakistan

It is quite well known fact that installing a solar system at your home requires a large initial investment. But it is also known that solar panels have a typical life period of 25 years. Other equipment used in a solar system such as batteries, charge controllers and inverters have a shorter life span and may need to be replaced every 2-4 years. In this article we try to calculate the payback time of a simple solar system that uses all its energy in real time converting DC voltage produced by the solar panel to AC voltage through an inverter.

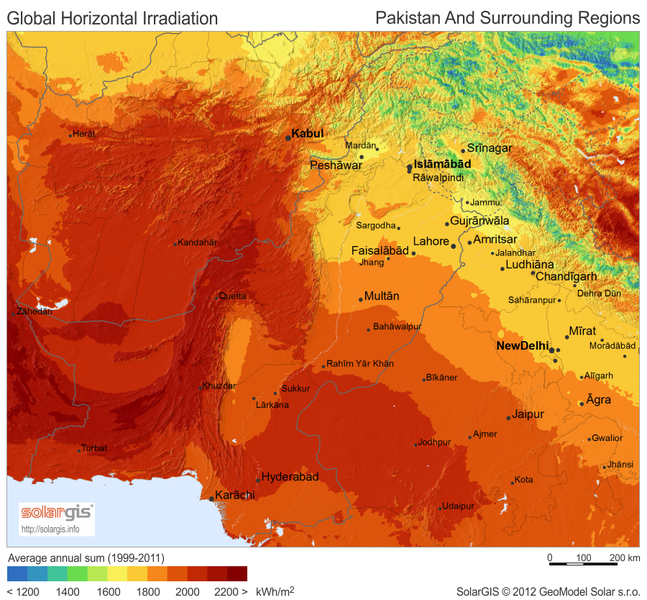
Let us assume that our load requirement is 500 W and we have 5 solar panels of 100 W each. We next assume that we have an inverter also rated at 500 W. Let us further assume that the solar panels receives peak sunshine for 6 hours daily (this is called Peak Sun Hours and is quite complicated to explain in this brief article). Therefore the total energy produced during a 24 hour period is

500 W x 6 hr = 3000 Whr = 3 kWhr

In one month the solar panel would produce

3 kWhr x 30 = 90 kWhr or 90 units of energy

Now assuming that a unit of energy is sold to you at Rs. 15 (including all the taxes and surcharges) the total savings per month are

90 units x Rs. 15/unit = Rs. 1350

Now let us look at the investment we made in the solar system. Solar panels are widely available in the local market for Rs.100/watt. This results in Rs. 50,000 investment in solar panels. An additional Rs. 10,000 are spent in the inverter. So the total cost of the solar system is Rs. 60,000.

So the payback time of this solar system is

60,000 / 1350 = 45 months or 3.75 years

This is highly encouraging because all your investment is recovered in less than 4 years and you have 21 years of free energy from your solar system.

Solar Payback Time in Pakistan is about 4 Years

Solar Payback Time in Pakistan is about 4 Years

Note:

1. The above analysis is also valid for grid tied systems where the energy is sold to the grid during the off peak hours (day time) and  bought from the grid during peak hours (evening, night time).

2. A real system would also need some batteries to provide backup when there is a power shut down and solar energy is also not available.

3. Although solar system is expected to have 25 years of life, it will not operate at 100% throughout this life period e.g. it might be operating at only 80% after 20 years.
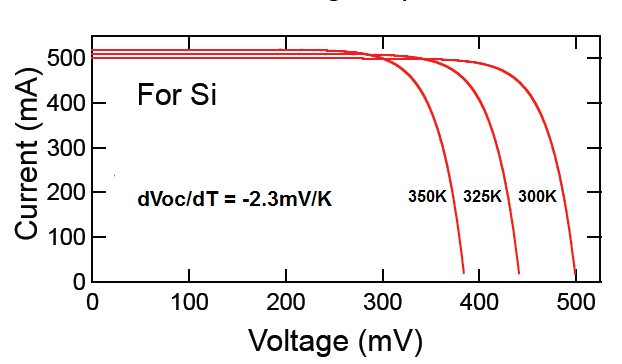
Solar Irradiance as a Function of Wavelength

Solar Irradiance I(\lambda) refers to Solar Energy falling on to the Earth on a unit area. Since this Solar Energy is limited to certain wavelengths (or frequencies) therefore it is usually given as a function of wavelength and the has the units of Watts/m2/wavelength. This is shown in the figure below for a unit area perpendicular to the solar rays and lying outside the Earth's atmosphere. This is referred to as AM0 since there is zero atmosphere, as opposed to AM1.5 which is on the Earth's surface.

Solar Spectra

So roughly speaking we can say that most of the Solar Energy lies between the 0 to 4 micrometer (NREL gives the AM0 spectrum from 280 to 4000 nanometer). A device that can capture all of this energy would be very useful and this is the aim of all modern Solar Cell manufacturers. The total Solar Power available on a surface of unit area can be easily calculated by integrating the above given Solar Irradiance curve from 0 to infinity and this gives us a magic number of 1367W/m2 (the value of the dotted curve at 4000 nanometer).

But all of this power does not reach the Earth's surface. Some of it is absorbed on the way. The total Solar Power available on the Earth's surface is equal to 1000W/m2 i.e. a reduction of 27% from that outside the Earth's atmosphere. The magic number of 1367W/m2 might be important for satellites using Solar Panels for their energy requirements and orbiting the Earth outside its atmosphere.

The Solar Spectra can also be calculated by using the theory of Black Body Radiation. According to this the Solar Spectra can be well estimated by a Black Body radiating at a temperature of 5960K (blue curve).

Note:

1. The Irradiance of 1000W/m2 is under ideal conditions (bright sunny day, at zero altitude and solar rays perpendicular to the capturing surface) but even this is not available to a Solar Home since the Solar Panels only have 15%-20% efficiency. So a 1m2 Solar Panel might only give you 150W-200W under ideal conditions. But do not get depressed yet as new research findings promise Solar Cells with efficiencies as high as 45%.

Primary and Secondary Batteries

A battery is a device that is used to store electrical energy in a solar system. The energy stored in a battery also called the charge capacity is given in Ampere Hours (AH). A 10AH battery can give 1A for 10hours or 2A for 5hours or any other combination. The voltage of the battery together with its charge capacity defines the energy stored in Watt Hours (WH) e.g. a 10AH battery operating at 12V can store 120WH of electrical energy. The energy storage capacity of a battery depends upon the type and weight of the material used. An important metric in this regard is the energy storage capacity per kilogram of material (WH/kg). Additionally, homeowners who need to conduct electrical inspections as well as battery installations may consider hiring a qualified ontario electrician for professional services. When it comes to tasks like seattle electrical panel upgrade, seeking expert assistance ensures both safety and compliance with local regulations. However, when looking for a plumber, seeking expert assistance for tasks ensures both safety and compliance with local regulations, providing peace of mind knowing that your plumbing needs are in capable hands.

Batteries are composed of two terminals called anode (negative) and cathode (positive) and an electrolyte. Based upon the materials used in construction of batteries they can be classified into primary or secondary. In this table, you will see the construction of both primary and secondary batteries.

Primary and Seconday Battery Types

 Primary Cells or Batteries

• Not rechargeable
• Electrolyte is contained by absorbent (dry cell)
• Convenient, inexpensive, lightweight
• Used for portable electronics and electric devices, lighting, and more
• Good shelf life
• High energy density
• No or low maintenance
• Usually small-scale power

Secondary Cells or Batteries

• Rechargeable
• Used for energy storage applications, e.g., solar backup, automotive
• Used as a rechargeable primary battery (electronics, electrical car)
• High power density
• High discharge rate
• Usually lower energy density
• Poorer charge retention

We hope this article helps you in determining which batteries you would need for your home or business.


Solar Cell Temperature and Efficiency

It is a common misconception that the higher the temperature higher is the output of the solar cell. This is not true as the efficiency of a solar cell decreases with an increase in temperature and lower efficiency results in lower output power. So in fact, a bright sunny day, with sun rays perpendicular to the solar panel and cool weather is the ideal combination for higher performance of a solar panel.

Let us now look at this in a bit more detail. There are two basic reasons for the decrease in efficiency due to the increase in temperature.  One is the decrease in the band gap energy (Eg) and the other is the decrease in open circuit voltage (Voc) with the increase in temperature. The relationship between band gap energy and temperature is quite straightforward and is given as.

 E_{g} = E_{g}(0)-\genfrac{}{}{1}{0}{\alpha T^2}{T+\beta}

Band Gap Parameters

One might argue that the decrease in the band gap would allow for more carriers to be transferred to the conduction band and yield a higher output power. However, this is not true as the output power is the product of current and voltage and a lower voltage would reduce the power. In fact, there is an ideal range of band gap which produces the maximum energy. Going too high or too low would not yield the optimum results.

Next, we turn our attention to the open circuit voltage Voc. The relationship between temperature and open circuit voltage is not that straightforward. At first, it might seem the open circuit voltage increases with the increase in temperature as shown in the expression below.

 V_{oc} = \genfrac{}{}{1}{0}{k_{B} T}{e} ln \biggl[1+\genfrac{}{}{1}{0}{J_{L}}{J_{s}}\biggr]

But in reality, this is not the case. An increase in temperature results in an increase in intrinsic carrier concentration n which in turn results in higher reverse bias saturation current Js. There is a squared relationship here so an increase in intrinsic carrier concentration would cause a very large increase in reverse bias saturation current. And as is evident from the above formula this causes a decrease in open circuit voltage. This is also shown in the figure below.

Voc and Temperature

So to conclude a bright sunny morning in winter might not be the worst time to produce some solar energy (provided you have got your solar panel tilt right 🙂 ).

Fill Factor and Efficiency

IV Curve for Solar Cell

The Efficiency of a solar cell is an important metric that determines how much of the incident solar energy is converted to useful electrical energy e.g. a 1m2 solar panel with 15% Efficiency would convert a radiant energy of 1000W/m2 into 150W of useful electrical energy.

The Efficiency of a solar cell is sometimes defined in terms of the Fill Factor (FF) which is defined as.

 FF = \genfrac{}{}{1}{0}{J_{max} V_{max}}{J_{sc} V_{oc}}

Simply put its the ratio of area defined by (Vmax, Imax) to the area defined by (Voc, Isc) on the IV curve. And the Efficiency in terms of the Fill Factor is defined as.

 \eta = \genfrac{}{}{1}{0}{J_{sc} V_{oc} FF}{P_{s}}

The expression for Efficiency can be simplified by substituting FF in the above equation.

 \eta = \genfrac{}{}{1}{0}{J_{sc} V_{oc}}{P_{s}} \genfrac{}{}{1}{0}{J_{max} V_{max}}{J_{sc} V_{oc}}

or

 \eta = \genfrac{}{}{1}{0}{J_{max} V_{max}}{P_{s}}

Let us now look at some practical values for Efficiency and Fill Factor.

 \eta = \genfrac{}{}{1}{0}{J_{sc} V_{oc} FF}{P_{s}}

 \eta = \genfrac{}{}{1}{0}{(400) (0.70) (0.84)} {1000}

 \eta = 0.2352

This is the Efficiency ignoring certain practical issues of solar cells. Thus the typical Efficiency of mono-crystalline solar cells would be somewhat lower (15%-20%).

Note:
1. Vmax, Imax is the Voltage and Current respectively at the Maximum Power Point on the IV curve. Remember that Power is just the product of Voltage and Current.

2. From basic circuit theory, the power delivered from or to a device is optimized where the derivative (graphically, the slope) dI/dV of the I-V curve is equal and opposite the I/V ratio (where dP/dV=0). This is known as the Maximum Power Point (MPP) and corresponds to the "knee" of the curve.

3. A solar charge controller is used to charge the batteries from the solar panel operating at its Maximum Power Point.

4. The more rapid the drop in Current as the Voltage approaches the Open Circuit Voltage the closer will be the Fill Factor to the ideal value of 100%.

PN Diode Solar Cell

PN Diode Solar Cell

• Light hitting solar cell generates carriers
• Carriers are swept through depletion zone by the built-in voltage, resulting in photocurrent IL in the reverse bias direction
• Photocurrent generates voltage drop (V) across resistor
• This forward biases the pn junction, resulting in forward bias current IF
Sources of Shunt Resistance (Rsh or Rshunt)
• Leakage around junction edges
• Leakage through defects or impurity phases
Sources of Series Resistance (Rs or Rseries)
• Resistance in the semiconductor
• Resistance in the metal lines
• Contact resistance between conductor and semiconductor
Sources of Junction Non-ideality (1 ≤ m ≤ 2)
• Recombination of carriers in depleted region