Solar Resource Map of Pakistan

The map below shows the solar energy falling on a horizontal surface of area 1 m2 during one year. It can be seen that areas of Balochistan and Southern Sindh are most gifted while Peshawar, Lahore and Islamabad also have quite favorable conditions. Lets assume that we are installing a Solar System in Karachi where the annual irradiation is around 2000 kWhr/m2. This means that there is an average daily irradiation of around 5.5 kWhr/m2. This means that a Solar Panel of area 1 m2 would receive 5.5 kWhr per day or 1 kW for 5.5 hours daily. If the above Solar Panel has an efficiency of 20% we can produce 200 Watts of electrical energy from it for 5.5 hours each day.

Solar Resource Map of Pakistan

Solar Resource Map of Pakistan

Note:
1. The above map is for energy collected by a horizontal surface. A suitably tilted surface or a tracking one can obtain significantly more energy.

2. The received energy not only depends upon the relative position of the Sun and Earth but also on the atmospheric conditions such as cloud cover during different seasons.

Quaid-e-Azam Solar Park - The Reality

There have been conflicting claims about the capacity of Quaid-e-Azam Solar Park (QASP) in the media. While the the chief executive officer of the Quaid-i-Azam Solar Power (Pvt) Limited claims that the project is producing 12% more energy than expected, opposition parties are claiming that it is producing only 18 MW as compared to the advertised capacity of 100 MW. So what is the truth?

Energy vs Power

Actually both the parties are correct in some sense. While the project does have the capacity to produce 100 MW peak power, this only happens for a very short duration during the day (around noon time). When averaged over 24 hours the park is only producing about 20 MW. This can be easily calculated by assuming that the peak solar energy is available for 5 hours (typical for this region) and averaging it over 24 hours.

100 MW x (5/24) = 20.83 MW

We can also calculate the average power produced by the park by looking at the numbers provided by Quaid-i-Azam Solar Power (Pvt) Limited on its website. According to the website the park is producing 169 Gigawatt Hour as compared to the original estimates of 153 Gigawatt Hour per year (a 12% increase). But this is energy, how do we calculate power?

The answer is simple, divide the energy produced in a year by the number of hours in a year (365 x 24 = 8760 hours).

Average power produced = 169 GWH / 8760 hours = 19.29 MW

Cost of Production and Tariff

The good news is that there is very minimal cost of production of solar energy (there was an installation cost of Rs.13 billion plus there are about 700 security personnel deployed for the security of 700 Chinese engineers working in the park). The tariff can be easily calculated by the revenue earned and the energy produced. According to QASP sources, the revenue reached a peak of Rs. 320 million in September. Let's calculate the cost per unit from the total revenue earned in September and the energy produced in the month of September.

Cost per unit = Rs.320,000,000/(19,290kW * 24 hours * 30 days)= Rs. 23.04/unit.

So the QASP claim that it is costing a consumer Rs.12/unit is not true. The actual cost to a consumer is Rs.23.04/unit. Again the data has been taken from the QASP website.

Environmental Impact

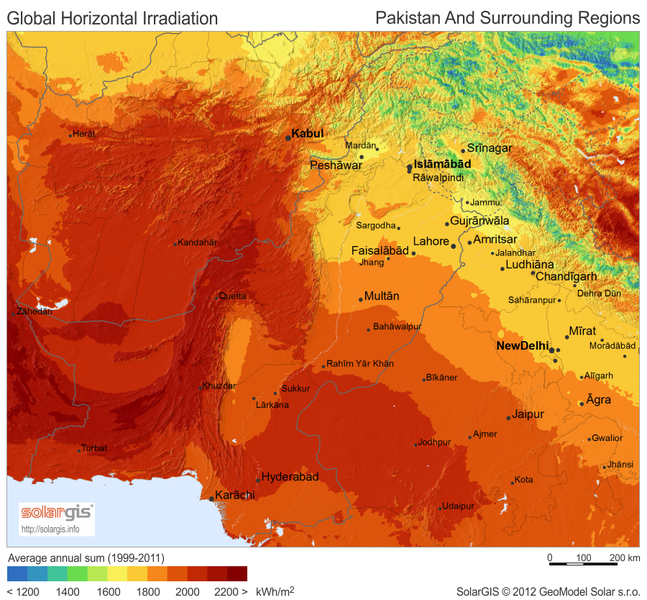
There is no doubt that there is going to be a negative impact on the environment. About 500 acres of desert have been taken over by QASP and this will definitely impact the biodiversity of the region. The total area dedicated to this project by Chief Minister of Punjab Mr. Shahbaz Sharif is 6500 acres (near Lal Sohanra National Park). Lastly there are vasts swaths of land in Balochistan which receive about 10-20% more Solar Irradiance than any location in Punjab and there are a number of new and existing Hydel projects that are crying for attention (case in point being Tarbela expansion which can yield additional 1400 MW of power).

Information taken from:

http://www.qasolar.com/

http://www.dawn.com/news/1217587/solar-park-producing-12pc-more-power-than-target

Solar Irradiance as a Function of Wavelength

Solar Irradiance I(\lambda) refers to Solar Energy falling on to the Earth on a unit area. Since this Solar Energy is limited to certain wavelengths (or frequencies) therefore it is usually given as a function of wavelength and the has the units of Watts/m2/wavelength. This is shown in the figure below for a unit area perpendicular to the solar rays and lying outside the Earth's atmosphere. This is referred to as AM0 since there is zero atmosphere, as opposed to AM1.5 which is on the Earth's surface.

Solar Spectra

So roughly speaking we can say that most of the Solar Energy lies between the 0 to 4 micrometer (NREL gives the AM0 spectrum from 280 to 4000 nanometer). A device that can capture all of this energy would be very useful and this is the aim of all modern Solar Cell manufacturers. The total Solar Power available on a surface of unit area can be easily calculated by integrating the above given Solar Irradiance curve from 0 to infinity and this gives us a magic number of 1367W/m2 (the value of the dotted curve at 4000 nanometer).

But all of this power does not reach the Earth's surface. Some of it is absorbed on the way. The total Solar Power available on the Earth's surface is equal to 1000W/m2 i.e. a reduction of 27% from that outside the Earth's atmosphere. The magic number of 1367W/m2 might be important for satellites using Solar Panels for their energy requirements and orbiting the Earth outside its atmosphere.

The Solar Spectra can also be calculated by using the theory of Black Body Radiation. According to this the Solar Spectra can be well estimated by a Black Body radiating at a temperature of 5960K (blue curve).

Note:

1. The Irradiance of 1000W/m2 is under ideal conditions (bright sunny day, at zero altitude and solar rays perpendicular to the capturing surface) but even this is not available to a Solar Home since the Solar Panels only have 15%-20% efficiency. So a 1m2 Solar Panel might only give you 150W-200W under ideal conditions. But do not get depressed yet as new research findings promise Solar Cells with efficiencies as high as 45%.