Researchers at Massachusetts Institute of Technology (MIT) have demonstrated a procedure to convert used lead acid batteries from automobiles into solar panels with the help of a solar power company. A single battery can be used to produce solar panels for as many as 30 homes. It must be noted that with the advancement in solar battery technology it is expected that 200 million lead acid batteries will be retired soon from USA alone. This development shows us a way forward to reusing a huge resource of lead that would otherwise go to dumping sites.
A material that is making this possible is organo lead halide perovskite. A layer of perovskite only 1/2 a micrometer thick is enough to produce a solar panel and does not require a very high manufacturing process like for other silicon based solar panels. One might think that this is another experimental material that achieves an efficiency in single digits. But this is hardly the case. In just a few years of research perovskite based solar cells have achieved efficiency of more than 19%. It is expected by the end of 2014 the efficiency would cross the psychological barrier of 20%.
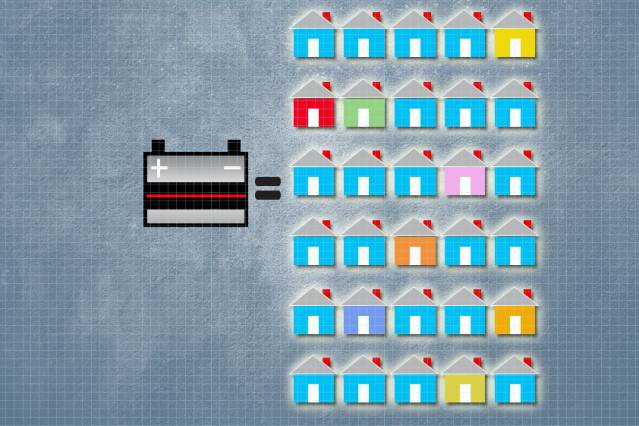
1 Battery Provides Solar Panels for 30 Homes
Perovskite (source: Wikipedia) is a calcium titanium oxide mineral species composed of calcium titanate, with the chemical formula CaTiO3. The mineral was discovered in the Ural Mountains of Russia by Gustav Rose in 1839 and is named after Russian mineralogist Lev Perovski (1792–1856).
It lends its name to the class of compounds which have the same type of crystal structure as CaTiO3 known as the perovskite structure. The perovskite crystal structure was first described by Victor Goldschmidt in 1926, in his work on tolerance factors. The crystal structure was later published in 1945 from X-ray diffraction data on barium titanate by Helen Dick Megaw.
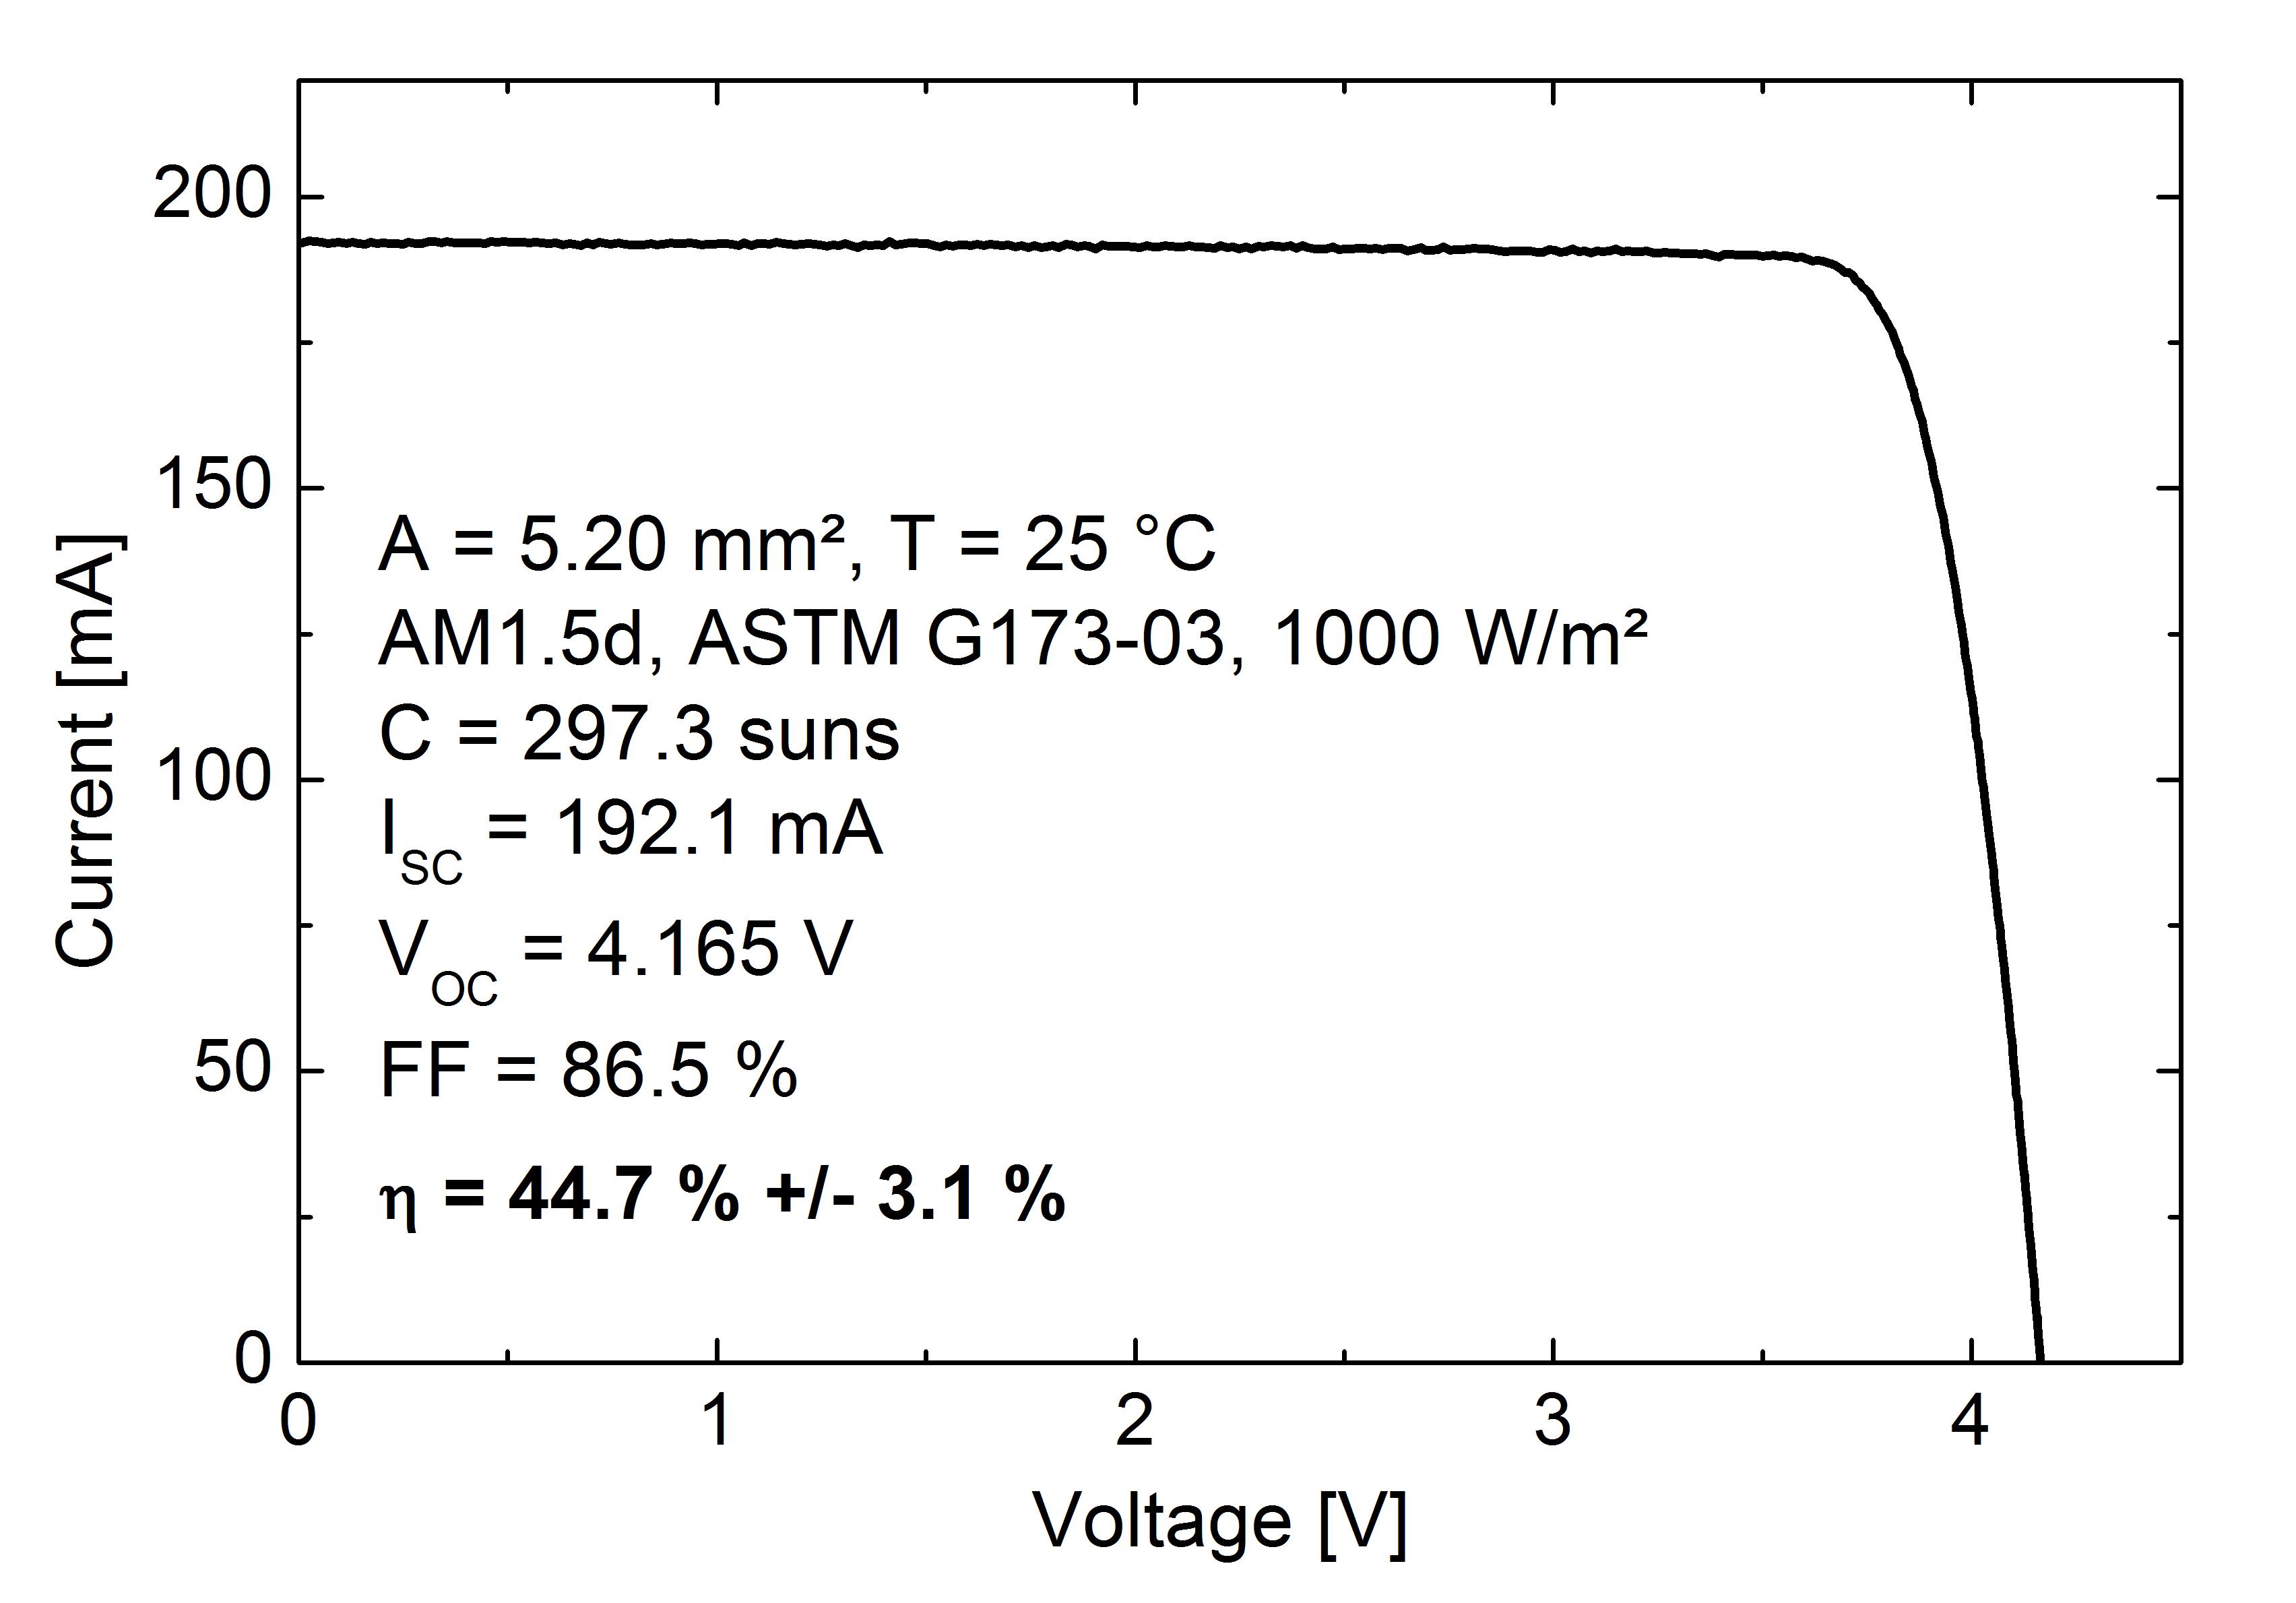
Efficiency of a solar panel is the ratio of the electrical energy produced to the incident solar radiation e.g. a 20% efficient solar panel of 1 m2 area would produce 200 W when the incident solar radiation reaches a level of 1000 W/m2 .


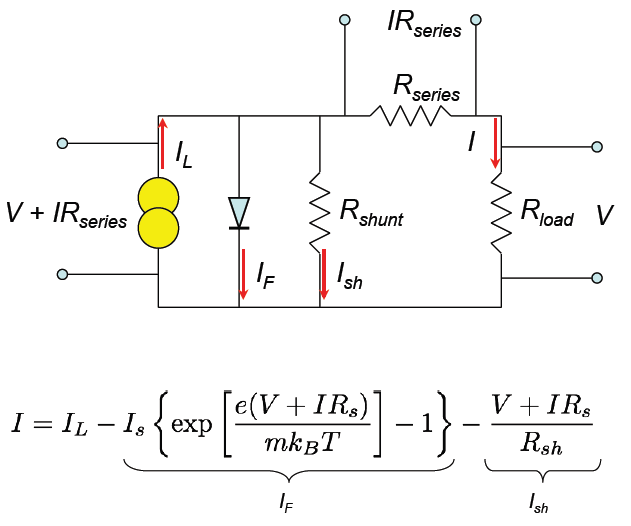
![V_{oc} = \genfrac{}{}{1}{0}{k_{B} T}{e} ln \biggl[1+\genfrac{}{}{1}{0}{J_{L}}{J_{s}}\biggr]](http://24solarhome.com/wp-content/plugins/latex/cache/tex_3ea87d6fa688d693a2bc180dce8479a1.gif)