Government Imposes 32.5% Tax on Solar

According to Finance Act 2014, the federal government has amended SRO 575 2006-07 and imposed a tax of 32.5% on import of Solar Panels. It must be noted that Solar Panels were placed in a special category with no tax since 2006. This was done to encourage the adoption of this Alternate Energy in the country. The government instead of taking steps to promote Solar Energy has taken the worst possible decision, at a time when the country is facing an acute energy crisis. The only possible explanation for this action is that the government intends to encourage local production of Solar Panels, which at the moment is minimal.

What is troubling is that the Alternate Energy Development Board (AEDB) which is tasked with increasing the Alternate Energy contribution in the country to about 5% by 2030 was not even consulted.

Solar Panel

The breakdown of the imposed tax is as follows.

General Sales Tax 17%

Import Duty 5%

Commercial Importer 3%

Income Tax on the Import 5.5%

The hardest hit are the importers who had imported Solar Panels in bulk and now have to pay taxes amounting to millions of rupees (5-6 million per container). According to sources, there are about 60 to 70 containers at the port which are waiting for clearance by customs. Also suffering are Solar solution providers who do not have enough equipment now to fulfill their commitments. It must be noted that energy demand reaches its peak in the summer months and this is the time when Solar businesses make their profits. Also to be hit is the agriculture sector where Solar Pumps have become quite popular in recent times.

The government has recently shown considerable interest in Solar technology with the launch of Quaid-e-Azam Solar Park in Bahawalpur. Previously, the Gillani government had also taken some steps to promote Alternate Energies in the country, such as starting Wind Energy projects in Jhimpir. It is hoped that better sense will prevail and the government will revisit the Fiance Act 2014 which has created this mess!

Note: Since this article was published on July 29, 2014 there has been another article that totally refutes the imposition of any additional taxes on solar equipment. According to this article titled Demystifying the Tax on Solar Panels "if an importer verified the import (through the Engineering Development Board) as a unique product not manufactured or available in Pakistan, the importer would not have to pay custom tax". The news item about the imposition of tax may have been untrue but it did have some effect as the 60-70 containers stuck at Karachi were immediately released.
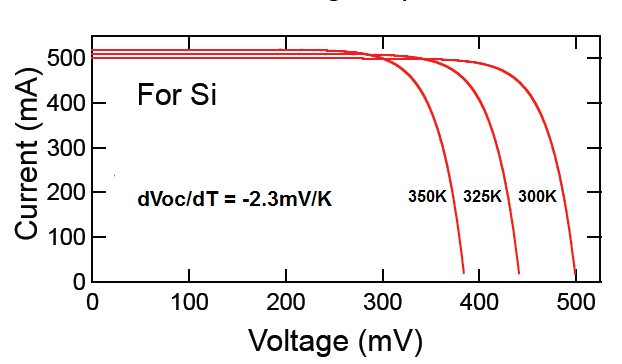
Quaid-e-Azam Solar Park - ROI

The government of Pakistan has recently launched the Quaid-e-Azam Solar Park in the Cholistan desert near Bahawalpur. The project aims to produce 100 MW of electrical energy by end of 2014 and 1000 MW by end of 2016. This is a small step in the right direction. Countries like India, China and Germany are much ahead in the game with installed solar projects of 2600 MW, 20000 MW and 36000 MW respectively. Let us take a closer look at the price that we will have to pay for the energy produced.

The cost of the 100 MW project is around $131 million, that is the price per Watt is $1.31. That seems to be quite good, lets look closely. We know that 400,000 panels are to be installed in the first phase to produce 100 MW of electrical energy. This means that each Solar Panel would produce 250 W and the cost of each panel would be $327.5 or Rs.32750.

Assuming that there is peak solar energy available for six hours daily, each solar panel would produce 1.5 kWhr of energy each day or 547.5 kWhr of energy per year. This amounts to 13687.5 kWhr of energy over a 25 year period (assuming that the performance of the Solar Panels does not degrade over the 25 year period). Now assuming that each unit of energy (kWhr) is sold at Rs.15 the total energy produced by the Solar Panel over its life period amounts to Rs.205312.5 i.e the revenue earned from selling electricity is 6.27 times the investment (205312.5/32750=6.27).

Solar Park Bahawalpur

Solar Park Bahawalpur

In other words the investment is recovered in 4 years and you have free electricity for the remaining 21 years. Please note that the above calculations do not include the operational costs, if any. Also, the above analysis assumes that the performance of the Solar Panels does not degrade over its life time.

Final Comment: The location of the proposed project does not seem to be optimum as Bahawalpur is receiving 2000 kWhr per squared meter per year as opposed to vast expanses of Balochistan that receive 2200 kWhr per squared meter per year.

World Record Solar Cell with 44.7% Efficiency

Do Numbers Make Sense

World Record IV

Press Release

"The Fraunhofer Institute for Solar Energy Systems ISE, Soitec, CEA-Leti and the Helmholtz Center Berlin have jointly announced that they have achieved a new world record for the conversion of sunlight into electricity using a new solar cell structure with four solar subcells. Surpassing competition after only over three years of research, and entering the roadmap at world class level, a new record efficiency of 44.7% was measured at a concentration of 297 suns. This indicates that 44.7% of the solar spectrum's energy, from ultraviolet through to the infrared, is converted into electrical energy. This is a major step towards reducing further the costs of solar electricity and continues to pave the way to the 50% efficiency roadmap".

"These solar cells are used in concentrator photovoltaics (CPV), a technology which achieves more than twice the efficiency of conventional PV power plants in sun-rich locations. The terrestrial use of so-called III-V multi-junction solar cells, which originally came from space technology, has prevailed to realize highest efficiencies for the conversion of sunlight to electricity. In this multi-junction solar cell, several cells made out of different III-V semiconductor materials are stacked on top of each other. The single subcells absorb different wavelength ranges of the solar spectrum".

A Closer Look at the Numebrs

Let us now try to validate the numbers given above.

Power is the product of voltage and current.

Pideal=Voc Isc=(4.165)(0.1921)=0.8001Watts

Pmax=Pideal*FF=(0.8001)(0.8650)=0.6921Watts

This is the power produced by 5.20mm2 of solar cell.

1mm2 of solar cell would produce 0.1331Watts.

1m2 of solar cell would produce 133.1kW of solar energy.

This is the power generated due to 297.3 suns.

A single sun would produce 133.1kW/297.3=447.67Watts of power.

This gives us an efficiency of 447.67/1000=0.4477=44.77%.

Solar Cell Temperature and Efficiency

It is a common misconception that the higher the temperature higher is the output of the solar cell. This is not true as the efficiency of a solar cell decreases with an increase in temperature and lower efficiency results in lower output power. So in fact, a bright sunny day, with sun rays perpendicular to the solar panel and cool weather is the ideal combination for higher performance of a solar panel.

Let us now look at this in a bit more detail. There are two basic reasons for the decrease in efficiency due to the increase in temperature.  One is the decrease in the band gap energy (Eg) and the other is the decrease in open circuit voltage (Voc) with the increase in temperature. The relationship between band gap energy and temperature is quite straightforward and is given as.

 E_{g} = E_{g}(0)-\genfrac{}{}{1}{0}{\alpha T^2}{T+\beta}

Band Gap Parameters

One might argue that the decrease in the band gap would allow for more carriers to be transferred to the conduction band and yield a higher output power. However, this is not true as the output power is the product of current and voltage and a lower voltage would reduce the power. In fact, there is an ideal range of band gap which produces the maximum energy. Going too high or too low would not yield the optimum results.

Next, we turn our attention to the open circuit voltage Voc. The relationship between temperature and open circuit voltage is not that straightforward. At first, it might seem the open circuit voltage increases with the increase in temperature as shown in the expression below.

 V_{oc} = \genfrac{}{}{1}{0}{k_{B} T}{e} ln \biggl[1+\genfrac{}{}{1}{0}{J_{L}}{J_{s}}\biggr]

But in reality, this is not the case. An increase in temperature results in an increase in intrinsic carrier concentration n which in turn results in higher reverse bias saturation current Js. There is a squared relationship here so an increase in intrinsic carrier concentration would cause a very large increase in reverse bias saturation current. And as is evident from the above formula this causes a decrease in open circuit voltage. This is also shown in the figure below.

Voc and Temperature

So to conclude a bright sunny morning in winter might not be the worst time to produce some solar energy (provided you have got your solar panel tilt right 🙂 ).

Fill Factor and Efficiency

IV Curve for Solar Cell

The Efficiency of a solar cell is an important metric that determines how much of the incident solar energy is converted to useful electrical energy e.g. a 1m2 solar panel with 15% Efficiency would convert a radiant energy of 1000W/m2 into 150W of useful electrical energy.

The Efficiency of a solar cell is sometimes defined in terms of the Fill Factor (FF) which is defined as.

 FF = \genfrac{}{}{1}{0}{J_{max} V_{max}}{J_{sc} V_{oc}}

Simply put its the ratio of area defined by (Vmax, Imax) to the area defined by (Voc, Isc) on the IV curve. And the Efficiency in terms of the Fill Factor is defined as.

 \eta = \genfrac{}{}{1}{0}{J_{sc} V_{oc} FF}{P_{s}}

The expression for Efficiency can be simplified by substituting FF in the above equation.

 \eta = \genfrac{}{}{1}{0}{J_{sc} V_{oc}}{P_{s}} \genfrac{}{}{1}{0}{J_{max} V_{max}}{J_{sc} V_{oc}}

or

 \eta = \genfrac{}{}{1}{0}{J_{max} V_{max}}{P_{s}}

Let us now look at some practical values for Efficiency and Fill Factor.

 \eta = \genfrac{}{}{1}{0}{J_{sc} V_{oc} FF}{P_{s}}

 \eta = \genfrac{}{}{1}{0}{(400) (0.70) (0.84)} {1000}

 \eta = 0.2352

This is the Efficiency ignoring certain practical issues of solar cells. Thus the typical Efficiency of mono-crystalline solar cells would be somewhat lower (15%-20%).

Note:
1. Vmax, Imax is the Voltage and Current respectively at the Maximum Power Point on the IV curve. Remember that Power is just the product of Voltage and Current.

2. From basic circuit theory, the power delivered from or to a device is optimized where the derivative (graphically, the slope) dI/dV of the I-V curve is equal and opposite the I/V ratio (where dP/dV=0). This is known as the Maximum Power Point (MPP) and corresponds to the "knee" of the curve.

3. A solar charge controller is used to charge the batteries from the solar panel operating at its Maximum Power Point.

4. The more rapid the drop in Current as the Voltage approaches the Open Circuit Voltage the closer will be the Fill Factor to the ideal value of 100%.